S&P500 LDN Open Trading Update 27/5/26

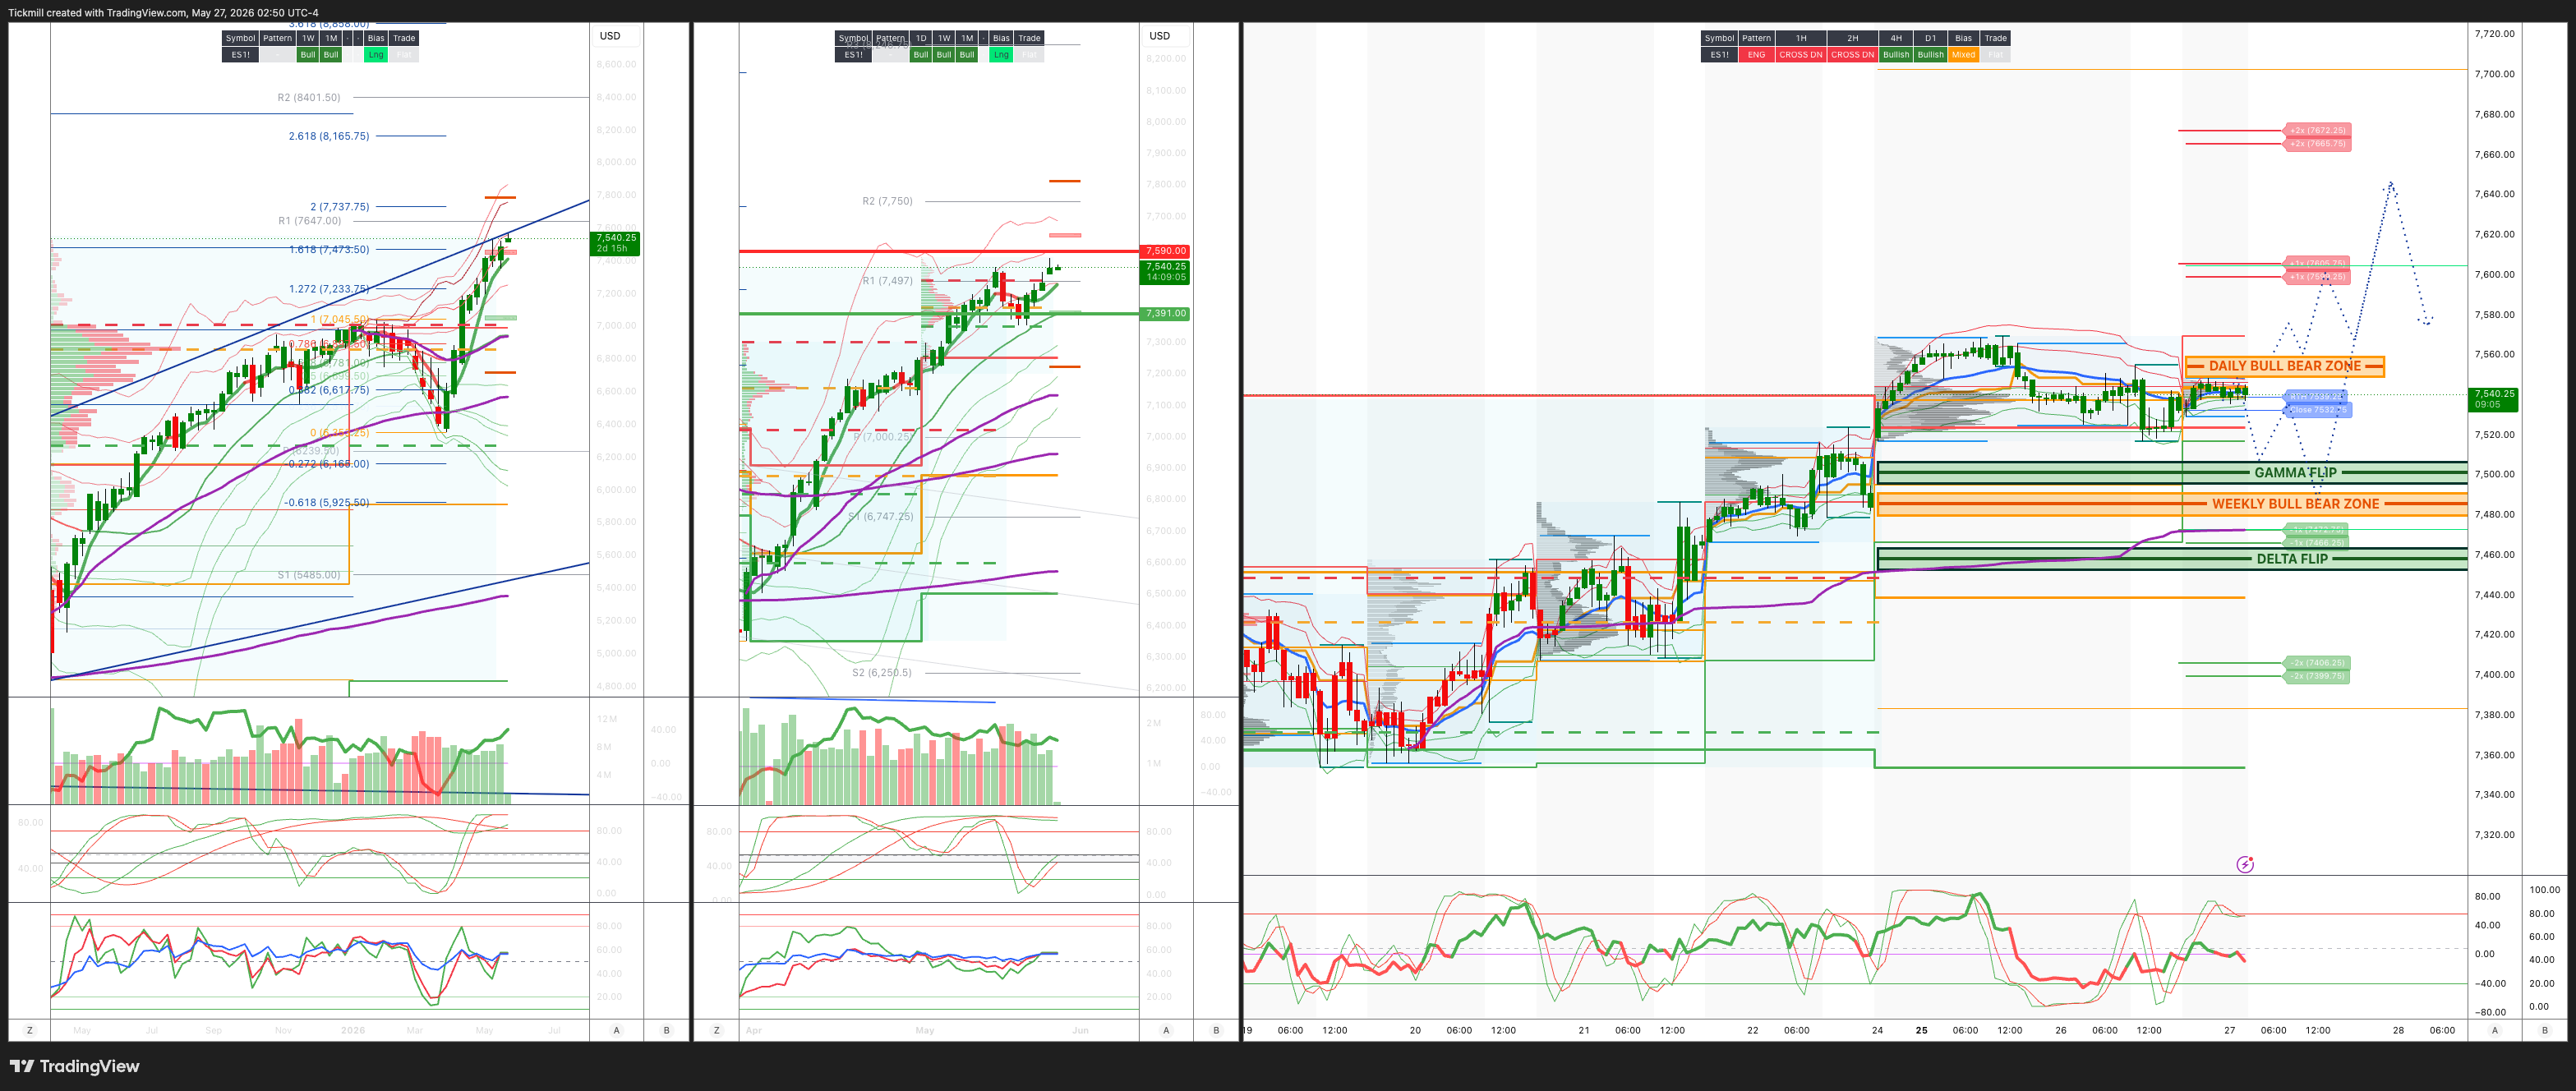
S&P500 LDN Open Trading Update 27/5/26
***QUOTING ES1! FOR CASH US500 EQUIVALENT LEVELS, SUBTRACT POINT DIFFERENCE***
WEEKLY BULL BEAR ZONE 7490/80
WEEKLY RANGE RES 7590 SUP 7391
June MOPEX Straddle: 274pt range implies a OPEX to OPEX range of [7134, 7683]
June QOPEX Straddle is 546.4pt giving us a range of [5960,7052]
JHEQX Q2 Collar 6189/6290 - 6865/6955
DEC2025 OPEX to DEC2026 OPEX is 945 points giving us a range of [5889,7779]
SPX PUT/CALL RATIO 1.20 (The numbers reflect options traded during the current session. A put-call ratio below 0.7 is generally considered bullish, and a put-call ratio above 1.0 is generally considered bearish)
DAILY VWAP BULLISH 7485
WEEKLY VWAP BULLISH 7417
MONTHLY VWAP BULLISH 6898
DAILY STRUCTURE – OTFH - 7478
WEEKLY STRUCTURE – TBD
MONTHLY STRUCTURE - OTFH - 6514
Balance: This refers to a market condition where prices move within a defined range, reflecting uncertainty as participants await further market-generated information. Our approach to balance includes favouring fade trades at the range extremes (highs/lows) while preparing for potential breakout scenarios if the balance shifts.
One-Time Framing Higher (OTFH): This represents a market trend where each successive bar forms a higher low, signalling a strong and consistent upward movement.
One-Time Framing Lower (OTFL): This describes a market trend where each successive bar forms a lower high, indicating a pronounced and steady downward movement.
DAILY BULL BEAR ZONE 7550/60
GAMMA FLIP 7500
DELTA FLIP 7459
DAILY RANGE RES 7605 SUP 7472
2 SIGMA RES 7656 SUP 7406
VIX BULL BEAR ZONE 19
TRADES & TARGETS
SHORT ON REJECT/RECLAIM DAILY BULL BEAR ZONE TARGET WEEKLY BULL BEAR ZONE
LONG ON ACCEPTANCE ABOVE DAILY BULL BEAR ZONE TARGET WEEKLY/DAILY RANGE RES
SHORT ON REJECT/RECLAIM WEEKLY/DAILY RANGE RES TARGET DAILY BULL BEAR ZONE
LONG ON ACCEPTANCE ABOVE DAILY BULL BEAR ZONE TARGET WEEKLK RANGE RES
***ADDITIONAL SETUPS & TARGETS HIGHLIGHTED ON THE CHARTS***
(I FADE TESTS OF 2 SIGMA LEVELS ESPECIALLY INTO THE FINAL HOUR OF THE NY CASH SESSION AS 90% OF THE TIME WHEN TESTED THE MARKET WILL CLOSE ABOVE OR BELOW THESE LEVELS)
GOLDMAN SACHS TRADING DESK VIEW - ‘Chase’
US equities started the post-holiday week with another strong risk-on session, led by growth, small caps, and Momentum. The S&P 500 closed up 61bps at 7,519, helped by a $2.8bn MOC buy imbalance, while the Nasdaq 100 gained 176bps to close at 30,001 and the Russell 2000 rose 179bps to 2,920. The Dow lagged, finishing down 23bps at 50,462. Volumes were broadly in line with trend, with 18.84bn shares trading across US equity exchanges versus a YTD daily average of 19bn. Cross-asset, the backdrop was supportive for duration-sensitive risk: WTI fell 306bps to $93.64, the US 10-year yield declined 7bps to 4.49%, DXY slipped 10bps to 99.14, gold fell 138bps to 4,507, and Bitcoin declined 162bps to $75,970. VIX, however, rose 253bps to 17.01, making this a notable spot-up, vol-up session.
The main story was the continued chase for Momentum, with memory and semis surging roughly 5% on the day despite limited obvious news flow. The move felt more like follow-through from the Hynix rally in Korea, combined with retail demand, ETF activity, levered trading, and quant-driven momentum rather than traditional fundamental buying. The DRAM ETF was tracking toward roughly $3bn notional traded, underscoring the role of retail and levered products in the move. Semis are now up 14% over five sessions, and the sector has outperformed NVDA by roughly 16.5 percentage points over that period, matching the largest five-day SOX versus NVDA spread since 2018. NVDA’s lag continued for a third day after earnings, consistent with a sell-the-news dynamic rather than a break in the broader AI thesis. The market appears to be using NVDA as a funding source while chasing higher-beta AI, memory, and semi expressions.
Floor activity was not especially busy despite the strength in price action. Overall activity was a 3 on a 1-to-10 scale, though the desk still finished 383bps to buy versus a 30-day average of 140bps to buy. The flow picture was not overly active to start the week, and there was a notable lack of instructional participation in Semis, AI, and Memory. That gives the rally a more technical feel, with the strongest moves appearing driven by quant, retail, and levered ETF demand rather than broad real-money conviction. Asset managers finished roughly flat on the day, with supply in macro and energy offset by demand in tech. Hedge funds were slight net buyers, led by scattered demand in discretionary and macro expressions of tech.
The derivatives tape was equally notable. It was a dramatic spot-up, vol-up day after the Memorial Day holiday, with NDX and RUT leading the advance. MU defined the session, closing up 19% and triggering strong demand for volatility on both the upside and downside. As the market broke higher, investors chased upside convexity but also bought downside protection, reflecting the tension between fear of missing the move and concern that the rally is becoming stretched. Skew relaxed notably on the move higher, consistent with strong call demand and reduced relative pricing for downside puts. Dealers remain long gamma locally and get longer on selloffs, which should help mute market moves in both directions. To the upside, the desk estimates dealers do not flip short gamma until the market is another 4-5% higher from here, suggesting the current positioning backdrop may continue to dampen realized volatility unless the rally extends meaningfully. The implied move through the end of the week is 0.96%
Single-name activity was concentrated in EM and tech names, while the non-profitable tech basket closed up 5%, further confirming the appetite for higher-beta, longer-duration risk. Lower yields and lower oil are giving investors permission to press growth, small caps, and speculative tech. The key test comes Thursday at 8:30am ET with core PCE and jobless claims. The implied move through the end of the week is 0.96%, so the market is pricing some event risk but not a major break. If the data allow yields to remain contained, the Momentum chase can continue. If rates reverse higher, the most extended parts of the tape, particularly memory and semis, are likely where positioning risk is most acute.
Overall, the market remains constructive but increasingly technical. The S&P is grinding higher, the Nasdaq has crossed 30,000, and small caps are participating, helped by falling oil and lower yields. But the sharpest moves are concentrated in memory, semis, and high-beta growth, where the rally appears more retail, quant, and levered-product driven than fundamentally sponsored. NVDA’s post-earnings underperformance is best viewed as rotation within AI rather than a rejection of the theme. The risk is not that the AI trade is dead; it is that the chase has become increasingly stretched and more vulnerable to a rates or positioning shock.
Disclaimer: The material provided is for information purposes only and should not be considered as investment advice. The views, information, or opinions expressed in the text belong solely to the author, and not to the author’s employer, organization, committee or other group or individual or company.
Past performance is not indicative of future results.
High Risk Warning: CFDs are complex instruments and come with a high risk of losing money rapidly due to leverage. 68% and 74% of retail investor accounts lose money when trading CFDs with Tickmill UK Ltd and Tickmill Europe Ltd respectively. You should consider whether you understand how CFDs work and whether you can afford to take the high risk of losing your money.
Futures and Options: Trading futures and options on margin carries a high degree of risk and may result in losses exceeding your initial investment. These products are not suitable for all investors. Ensure you fully understand the risks and take appropriate care to manage your risk.
Patrick has been involved in the financial markets for well over a decade as a self-educated professional trader and money manager. Flitting between the roles of market commentator, analyst and mentor, Patrick has improved the technical skills and psychological stance of literally hundreds of traders – coaching them to become savvy market operators!