S&P500 Daily Action Areas & Price Targets 16/10/26

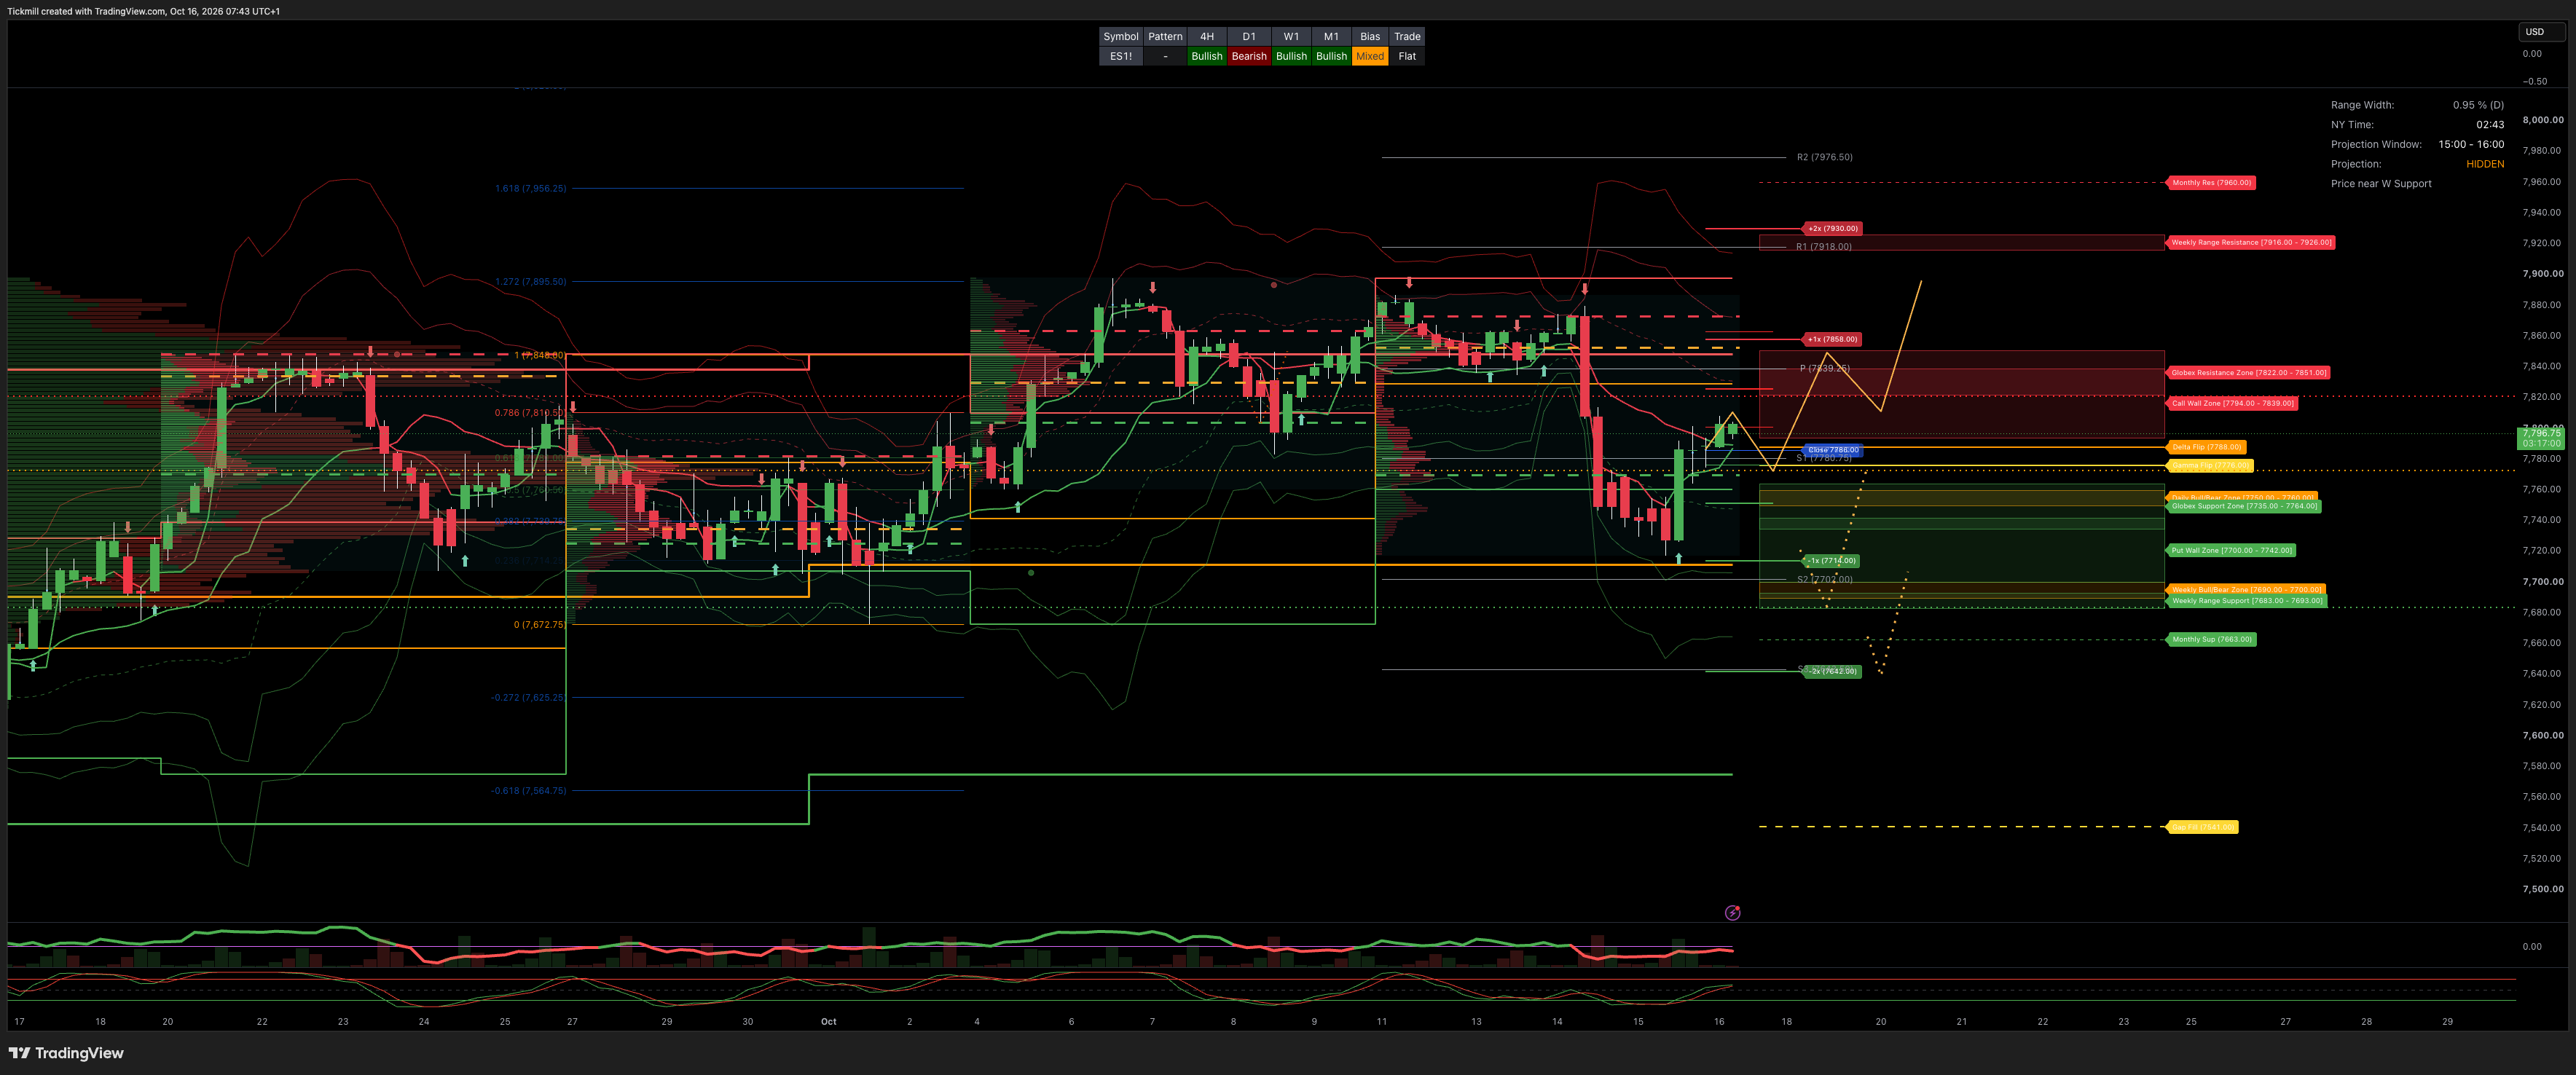
S&P500 Daily Action Areas & Price Targets 16/10/26
MONTHLY OPEX
***QUOTING ES1!(Z CONTRACT LEVLES) FOR CASH US500 EQUIVALENT LEVELS, SUBTRACT POINT DIFFERENCE***
MONTHLY-WEEKLY& DAILY LEVELS
MONTHLY BULL BEAR ZONE 7440/7400
MONTHLY RANGE RES 7960 SUP 7663
WEEKLY BULL BEAR ZONE 7700/7690
WEEKLY RANGE RES 7926/16 SUP 7683/93
DAILY BULL BEAR ZONE 7750/60
GLOBEX RANGE SUP 7764/35 RES 7822/51
GAMMA FLIP 7776
DELTA FLIP 7788
CALL WALLS 7839/7794
PUT WALLS 7742/7700
DAILY STRUCTURE - OTFL - 7801
WEEKLY STRUCTURE - BALANCE TBC
MONTHLY STRUCTURE - OTFH - 7542
VIX BULL BEAR ZONE 17.7
VVIX-to-VIX A ratio around 5.19 falls into the 5–6 range, which typically indicates tension building or a normal baseline where options traders begin hedging volatility risk while the base VIX stays relatively calm
PRIMARY TRADES & TARGETS
LONG ON REJECT/RECLAIM OF THE WBBZ TARGET RTH CLOSE
***ADDITIONAL SETUPS & TARGETS HIGHLIGHTED ON THE CHARTS***
(I FADE TESTS OF 2 SIGMA LEVELS ESPECIALLY INTO THE FINAL HOUR OF THE NY CASH SESSION AS 90% OF THE TIME WHEN TESTED THE MARKET WILL CLOSE ABOVE OR BELOW THESE LEVELS)
SPX PUT/CALL RATIO 1.15 (The numbers reflect options traded during the current session.) A put-call ratio below 0.7 is generally considered bullish, and a put-call ratio above 1.0 is generally considered bearish.
JHEQX Upside cap (~7,920–7,950): Dealer gamma hedging at this call strike creates resistance, with market makers likely selling futures into strength and limiting volatility. Downside cushion (~7,270): If SPX drops 5% into Q4, long put gamma may force dealers to buy futures as the index falls, helping stabilize prices. Expiration: December 31, 2026. Strong pinning effects are likely near key strikes into year-end expiration.
DEC2025 OPEX to DEC2026 OPEX is 945 points giving us a range of [5889,7779]
Notes On Structure Implications
Balance: This refers to a market condition where prices move within a defined range, reflecting uncertainty as participants await further market-generated information. Our approach to balance includes favouring fade trades at the range extremes (highs/lows) while preparing for potential breakout scenarios if the balance shifts.
One-Time Framing Higher (OTFH): This represents a market trend where each successive bar forms a higher low, signalling a strong and consistent upward movement.
One-Time Framing Lower (OTFL): This describes a market trend where each successive bar forms a lower high, indicating a pronounced and steady downward movement.
GOLDMAN SACHS FICC & EQUITY TRADING DESK VIEWS
THE TAKE: MARKET BROADENS AS AI DERISKING CLEANS UP POSITIONING
US equities staged a "squeezy" intraday rebound off morning lows, with the S&P 500 closing up +33 bps to 7,744 (despite a $5B MOC sell imbalance) and the Dow Jones rallying +1.08% to 52,177. Small caps led the charge, with the Russell 2000 outperforming +1.34% to 2,766, while the tech-heavy Nasdaq-100 closed essentially flat at 29,935 (-5 bps).
The early-morning session opened under severe pressure following an overnight -7% slump in South Korean equities and heavy initial Long-Only (LO) selling in Semiconductors. However, as supply in tech abated midday, a clear flight-to-safety bid into Mag7, Consumer Staples, MedTech/Tools, and Financials lifted the tape. Unlike the July momentum unwind—which was primarily technical—current price action reflects deeper macroeconomic debates as credit concerns seep into the AI capex cycle. On a valuation basis, the Nasdaq-100 forward P/E has compressed back to ~21x (its lowest level since the AI cycle began in 2023), offering a supportive valuation entry point as Q3 earnings accelerate.
MARKET SUMMARY & ASSET BREAKDOWN
S&P 500 (SPX): Closed at 7,744.00 (+0.33%) | MOC $5.0B to SELL | VIX down -2.37% to 16.47 | Remaining 1-day straddle: 54 bps
Nasdaq-100 (NDX): Closed at 29,935.00 (-0.05%) | Intraday Tech supply absorbed by Mag7 quality bidding
Russell 2000 (RUT): Closed at 2,766.00 (+1.34%) | Strong outperformance led by short squeezes in rate-sensitive names
Dow Jones (DJI): Closed at 52,177.00 (+1.08%) | Outperformed on flight-to-safety rotation into value/financials
US 10-Year Treasury: Yield down -9.6 bps to 5.0892% | Sharp rally in duration providing rate relief
WTI Crude: Price up +2.74% to $97.71/bbl | Sustained commodity price rally adding to macro uncertainty
Gold: Price up +1.65% to $4,173.00/oz | Rebounded in tandem with falling 10-Year yields and softening USD (DXY 102.03)
Bitcoin: Price up +0.72% to $82,299.00 | Bounced off intraday support
AI POSITIONING METRICS & CLEANUP
Yesterday marked the 2nd largest net selling in the past year in the GS Global AI Basket (GSXGGLAI). Institutional length in the AI trade has cleaned up considerably relative to June/July extremes:
Global AI Net Allocation: Net allocation to Global AI equities (as a % of total global single stock net market value) currently stands at 26.1% (down from a peak of 31.7% in early June), placing it in the 49th percentile 1-year and 83rd percentile 3-year.
Global AI Long/Short Ratio: Aggregate L/S market value ratio across Global AI stocks sits at 3.27 (down from 4.34 in early June), ranking in the 7th percentile 1-year and 64th percentile 3-year.
GS Sentiment Indicator: Has printed negative for 6 consecutive weeks, with the latest reading matching multi-year lows at -1.3 SD, confirming overall institutional length is far from max long.
INSTITUTIONAL FLOWS & DERIVATIVES COLOR
Execution Floor Activity (6/10 Afternoon / 8/10 Morning):
Morning floor activity spiked to an 8/10 with Long-Only accounts -40% better for sale. Flow stabilized into the close (6/10) with LOs finishing -25% better for sale (tech supply offset by demand in Financials and Healthcare).
Hedge Funds finished benign at -3% better for sale across Tech, Healthcare, and Discretionary.
Factor Squeezes & Leaderboards:
Squeezy price action was led by heavily shorted and beat-down factor baskets: GS High Beta 12m Losers (
GSCBLMOM) and GS Liquid Most Short (GSXUMSAL) topped the floor leaderboards.
Derivatives & Volatility Surface:
Option Skew Crush: Option skew opened offered and got crushed lower as spot stabilized. Fixed strike vols trickled lower, with gamma tenors offered most aggressively.
Russell 2000 Implied Volatility: RUT volatility caught a selective bid in the belly and back end of the curve alongside spot outperformance.
Mag7 Option Restructuring: Clients entered to monetize hedges, defend positions, and roll down strikes. Notably, a major GS customer executed a neutral option structure in Nvidia (
NVDA), buying 70,000 Nov 230/260 Call Spreads and selling 70,000 Nov 245/295 Call Spreads.
Disclaimer: The material provided is for information purposes only and should not be considered as investment advice. The views, information, or opinions expressed in the text belong solely to the author, and not to the author’s employer, organization, committee or other group or individual or company.
Past performance is not indicative of future results.
High Risk Warning: CFDs are complex instruments and come with a high risk of losing money rapidly due to leverage. 68% and 74% of retail investor accounts lose money when trading CFDs with Tickmill UK Ltd and Tickmill Europe Ltd respectively. You should consider whether you understand how CFDs work and whether you can afford to take the high risk of losing your money.
Futures and Options: Trading futures and options on margin carries a high degree of risk and may result in losses exceeding your initial investment. These products are not suitable for all investors. Ensure you fully understand the risks and take appropriate care to manage your risk.
Patrick has been involved in the financial markets for well over a decade as a self-educated professional trader and money manager. Flitting between the roles of market commentator, analyst and mentor, Patrick has improved the technical skills and psychological stance of literally hundreds of traders – coaching them to become savvy market operators!