S&P500 Trading Update 14/4/26

S&P500 Trading Update 14/4/26
***QUOTING ES1! FOR CASH US500 EQUIVALENT LEVELS, SUBTRACT POINT DIFFERENCE***
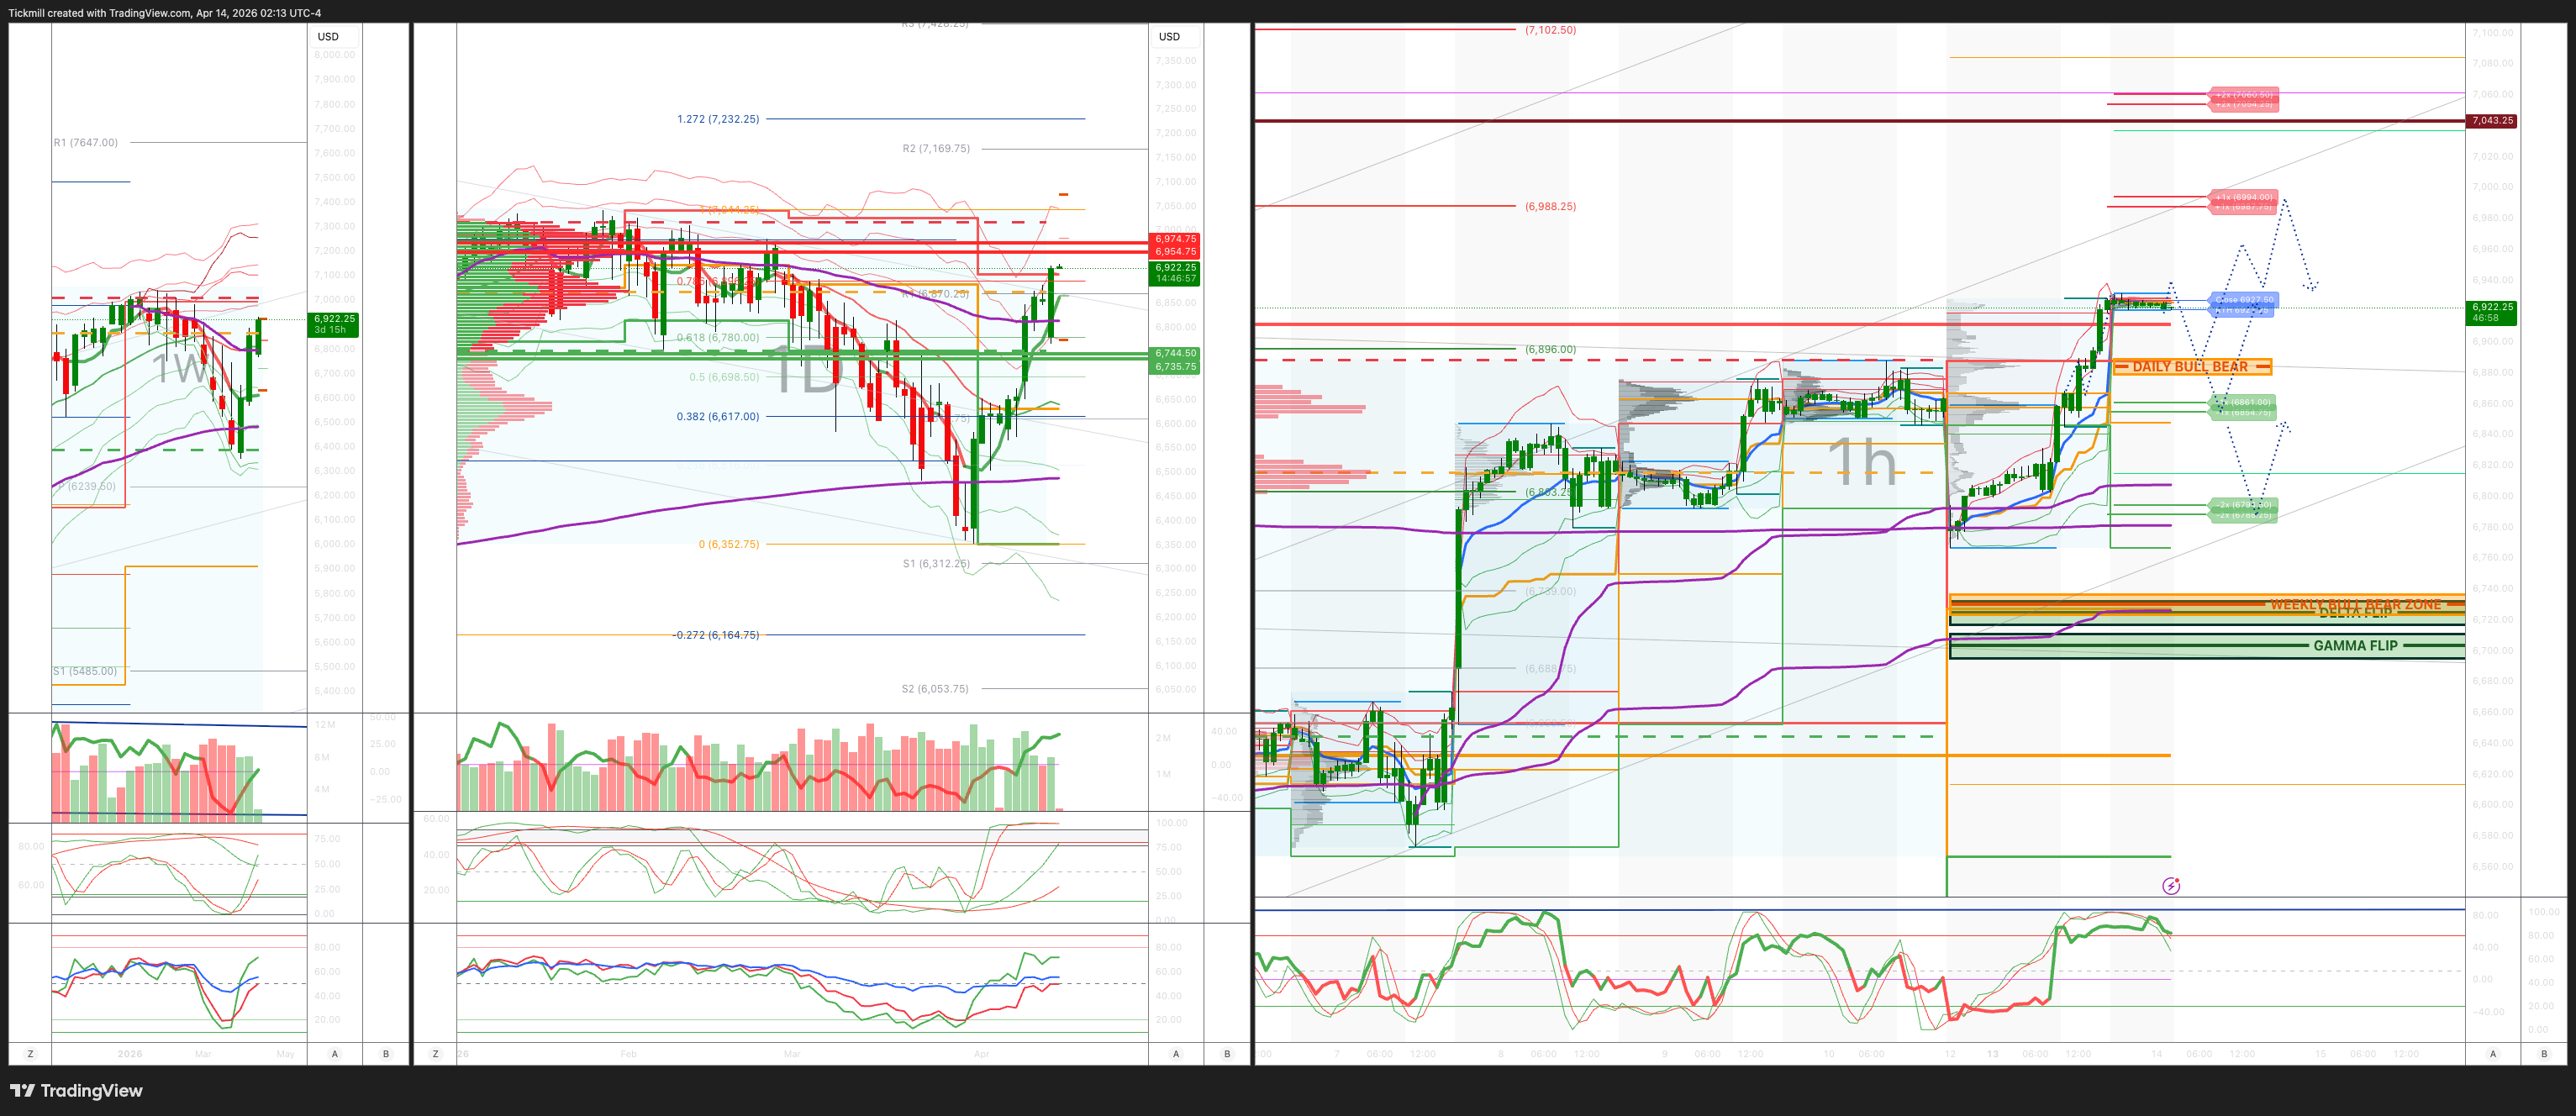
WEEKLY BULL BEAR ZONE 6730/20
WEEKLY RANGE RES 6745/35 SUP 6955/75
April OPEX Straddle: 328.55pt range implies a OPEX to OPEX range of [6177, 6835]
June QOPEX Straddle is 546.4pt giving us a range of [5960,7052]
JHEQX Q2 Collar 6189/6290 - 6865/6955
DEC2025 OPEX to DEC2026 OPEX is 945 points giving us a range of [5889,7779]
SPX PUT/CALL RATIO 1.06 (The numbers reflect options traded during the current session. A put-call ratio below 0.7 is generally considered bullish, and a put-call ratio above 1.0 is generally considered bearish)
DAILY VWAP BULLISH 6862
WEEKLY VWAP BULLISH 6591
MONTHLY VWAP BULLISH 6815
DAILY STRUCTURE – OTFH - 6826
WEEKLY STRUCTURE – OTFH
MONTHLY STRUCTURE - OTFD - 6911
Balance: This refers to a market condition where prices move within a defined range, reflecting uncertainty as participants await further market-generated information. Our approach to balance includes favouring fade trades at the range extremes (highs/lows) while preparing for potential breakout scenarios if the balance shifts.
One-Time Framing Higher (OTFH): This represents a market trend where each successive bar forms a higher low, signalling a strong and consistent upward movement.
One-Time Framing Down (OTFD): This describes a market trend where each successive bar forms a lower high, indicating a pronounced and steady downward movement.
DAILY BULL BEAR ZONE 6890/80
GAMMA FLIP 6704
DAILY RANGE RES 6994 SUP 6861
2 SIGMA RES 7060 SUP 6793
VIX BULL BEAR ZONE 22
TRADES & TARGETS
LONG ON REJECT/RECLAIM OF DAILY BULL BEAR ZONE TARGET WEEKLY RANGE RES > DAILY RANGE RES
***ADDITIONAL SETUPS & TARGETS HIGHLIGHTED ON THE CHARTS***
(I FADE TESTS OF 2 SIGMA LEVELS ESPECIALLY INTO THE FINAL HOUR OF THE NY CASH SESSION AS 90% OF THE TIME WHEN TESTED THE MARKET WILL CLOSE ABOVE OR BELOW THESE LEVELS)
GOLDMAN SACHS TRADING DESK VIEW - ‘Muted’
US equities closed higher in a low-volume session, with the S&P 500 rising 1.02% to 6,886 alongside a $3.26bn MOC buy imbalance. The Nasdaq 100 gained 1.06% to 25,384, the Russell 2000 advanced 1.52% to 2,670, and the Dow added 0.63% to 48,218. Total volume reached 15.8bn shares across US exchanges, below the 19.4bn YTD daily average. In macro markets, the VIX fell 0.57% to 19.12, WTI crude rose 1.38% to $97.88, the US 10-year yield slipped 3bps to 4.29%, gold declined 0.16% to 4,742, the DXY fell 0.26% to 98.39, and Bitcoin climbed 2.55% to $73,182.
Stocks gradually moved higher despite the absence of a US-Iran deal over the weekend and the US announcing a surprise blockade in the Strait of Hormuz. Trading activity remained light, with volumes running 14% below the 20-day average. One of the clearest themes on the day was a sharp reversal in the Software vs. Semis pair, as Software rallied 5%, marking one of its biggest one-day gains of the past decade. With the long/short ratio back near February lows, positioning still suggests selective re-risking rather than broad-based aggression. Recent flow patterns continue to show demand for leadership and shorting of laggards, with this dynamic especially visible within the AI complex.
According to prime brokerage data, US Info Tech recorded its largest net dollar selling in more than five years last week, led by Software, which accounted for roughly 60% of total net selling and was driven almost entirely by short sales. At the same time, mega-cap tech has now posted gains for 10 straight sessions, its longest streak since 2017, and is up 13% from the March lows. Interest appears to be returning ahead of earnings as sentiment improves, supported by continued AI and token-related momentum among hyperscalers, cleaner positioning, and Mag 7 valuations rebounding from trough levels relative to the S&P 500.
On the desk, overall activity remained subdued, with the floor rated a 3 out of 10 for activity. Even so, the floor finished +711bps to buy versus a 30-day average of -48bps. Asset manager and hedge fund flow skews were relatively muted. CTA demand remained a major support, with an estimated $19bn of net US equity buying over the past week, the largest weekly purchase since August 2024. In a flat tape, CTA models are expected to buy another $32bn of US equities, among the strongest weekly projections seen recently. The Nasdaq 100 has now risen for 9 consecutive sessions, a rare event over the last 40 years. Historically, after such streaks, the average 1-month return has been +2.78% with a median of +3.64%, while the average 3-month return has been +4.12% with a median of +4.31%.
In derivatives, volatility was calmer as spot drifted higher despite ongoing geopolitical headlines. Front-end vol stayed bid, while the back end of the curve was little changed. Skew eased broadly, especially in the front end of SPX. Desk flows were quieter overall, though there were notable buyers of SPX downside protection and software upside. One standout trade was a buyer of 50k IGV Dec 90 calls at $4.20 on 29 vol. CTA flows remain the key focus this week, with projected buying of $43bn of US equities over the next week in a flat or rising tape. While that demand is expected to moderate next week, it should still provide a supportive tailwind over the next month.
Looking ahead, the key macro events are PPI tomorrow and Jobless Claims on Thursday, both scheduled for 8:30am ET. On the corporate side, 8% of the S&P 500 is set to report earnings this week. The implied move through the end of the week is currently pricing at 130bps.
Disclaimer: The material provided is for information purposes only and should not be considered as investment advice. The views, information, or opinions expressed in the text belong solely to the author, and not to the author’s employer, organization, committee or other group or individual or company.
Past performance is not indicative of future results.
High Risk Warning: CFDs are complex instruments and come with a high risk of losing money rapidly due to leverage. 69% and 73% of retail investor accounts lose money when trading CFDs with Tickmill UK Ltd and Tickmill Europe Ltd respectively. You should consider whether you understand how CFDs work and whether you can afford to take the high risk of losing your money.
Futures and Options: Trading futures and options on margin carries a high degree of risk and may result in losses exceeding your initial investment. These products are not suitable for all investors. Ensure you fully understand the risks and take appropriate care to manage your risk.
Patrick has been involved in the financial markets for well over a decade as a self-educated professional trader and money manager. Flitting between the roles of market commentator, analyst and mentor, Patrick has improved the technical skills and psychological stance of literally hundreds of traders – coaching them to become savvy market operators!