Institutional Insights: Goldman Sachs 'Tech Liquidation & Retail ETF Chase'

EQUITY FLOWS & POSITIONING BRIEFING: HISTORIC TECH LIQUIDATION VS. RETAIL-LEVERED ETF CHASE
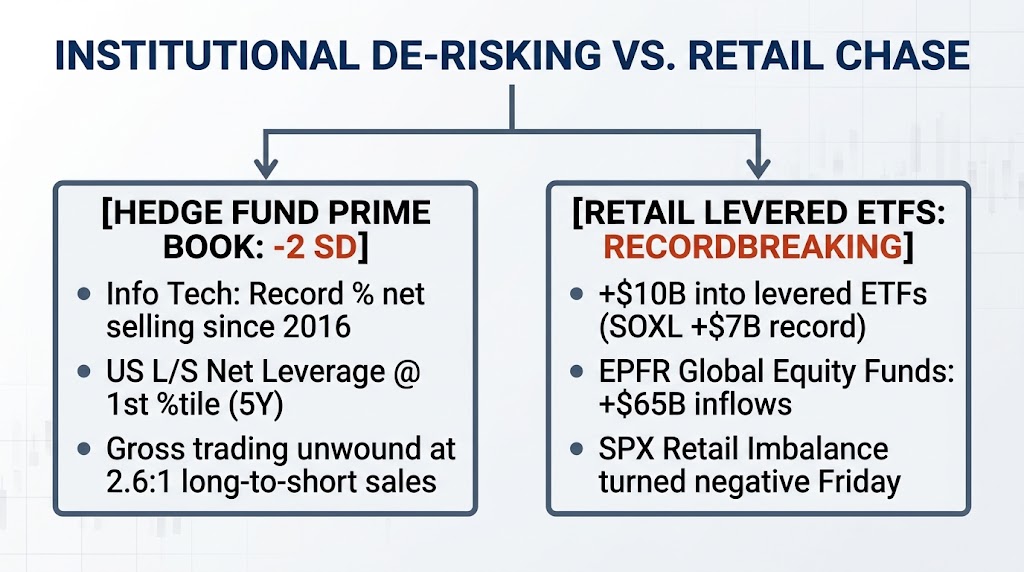
THE TAKE: INSTITUTIONAL -2 SD DE-GROSSING MEETS RECORD RETAIL LEVERED ETF INFLOWS
Global equity markets experienced an extraordinary institutional de-risking event last week. Goldman Sachs Prime Brokerage recorded a -2.0 Standard Deviation net selling event, driven by long sales outpacing short sales (2.6 to 1) at the fastest gross unwinding pace in nearly 3 months. Global Fundamental Long/Short Net Leverage plunged to 48.6% (a 1-year low), with US Fundamental L/S Net Leverage dropping to the 1st percentile on a 5-year lookback.
The primary catalyst was a historic liquidation of Information Technology. Tech suffered its largest percentage net selling on record (since 2016) alongside its largest 2-month de-grossing. However, retail traders took the exact opposite side of the institutional unwind. Despite the Philadelphia Semiconductor Index (SOX) posting its worst week of 2026 (-11%), nearly $10 billion poured into levered ETFs, led by a record +$7 billion inflow into Direxion Daily Semiconductor 3x Bull (SOXL).
1. PRIME BROKERAGE & SECTOR FLOW MATRIX
Global Leverage Breakdown:
Overall Book: Gross leverage rose +3.0 pts to 311.7% (79th percentile 1-year); Net leverage fell -3.2 pts to 72.7% (4th percentile 1-year). Long/Short ratio dropped to 1.609 (4th percentile 1-year).
Fundamental L/S Book: Gross leverage rose +1.4 pts to 210.9% (52nd percentile 1-year); Net leverage fell -4.2 pts to 48.6% (1-year low). US L/S Net Leverage sits at the 1st percentile over 5 years.
Regional & Sector Net Selling:
Regions: All major geographic regions were net sold, led in dollar terms by Emerging Markets Asia and North America. Europe turned net sold (1.8:1 long sales to short sales) after 3 weeks of risk-on flows.
Sectors: 8 of 11 global sectors were net sold, led by Information Technology, Industrials, and Consumer Discretionary. Health Care, Communication Services, and Consumer Staples were the only net-bought sectors.
European vs. North American Overweight:
Europe remains overweight on the GS book by +2.84% vs. MSCI World (+0.43 ppts WoW).
North America remains underweight at -15.77% vs. MSCI World (reduced by -1.62 ppts WoW).
2. SYSTEMATIC CTA FLOWS & S&P E-MINI PIVOT LEVELS
CTA 1-Week Unwind: Systematic trend-followers sold -$9.5B of global equities last week, reducing total global equity long length to ~$39B (42nd percentile).
1-Week & 1-Month Forward Forecast: Models project CTAs turning into net buyers over a 1-week and 1-month horizon in a flat market scenario, with European indices (FTSE 100 and DAX) modeled to capture the largest relative inflows.
S&P 500 E-Mini Systematic Pivots:
Short-Term Threshold: 7,716 (Breached during Friday's session, triggering short-term systematic selling)
Medium-Term Threshold: 7,508
Long-Term Threshold: 7,040
3. CORPORATE BUYBACK BLACKOUT EXIT & MUTUAL FUND FLOWS
Corporate Repurchase Blackout Status:
Desk execution volume held at 0.7x relative to 2024/2025 ADTV, skewed toward Financials, Health Care, and Consumer Discretionary. Programmatic 10b5-1 plans comprised 85% of execution volume.
Blackout Exit Ramp: ~12% of S&P 500 constituents are currently in an open window, expanding to 22% by Friday before reaching full open-window capacity in November.
EPFR Fund Flows ($30T AuM Sample):
Global Equity Inflows: Accelerated sharply to +$65B for the week ending Oct 14 (vs. +$12B prior week), led by US funds, Brazil, Mainland China, and Taiwan.
Sector Inflows/Outflows: Tech funds captured the largest net inflows globally (ahead of the late-week drawdown), while Industrials experienced the largest net outflows.
4. RETAIL & SENTIMENT EXTREMES
CNN Fear & Greed Index: Plunged into Extreme Fear at 18/100 (down from 46/100 prior week).
AAII Sentiment Survey: Bears rose +2.6 pts to 41.6%, Bulls fell -1.6 pts to 38.7%, and Neutrals fell to 19.7% (reflecting a more defensive stance vs. historical averages).
Retail Bid Exhaustion: The S&P retail order imbalance printed its first net negative day since July on Friday, confirming retail fatigue following the week's levered ETF buying surge.
Key Earnings Micro Catalysts This Week: Meta Platforms (
META), Tesla (TSLA), and Nvidia (NVDA) GTC Berlin keynotes on Wednesday.
Disclaimer: The material provided is for information purposes only and should not be considered as investment advice. The views, information, or opinions expressed in the text belong solely to the author, and not to the author’s employer, organization, committee or other group or individual or company.
Past performance is not indicative of future results.
High Risk Warning: CFDs are complex instruments and come with a high risk of losing money rapidly due to leverage. 68% and 74% of retail investor accounts lose money when trading CFDs with Tickmill UK Ltd and Tickmill Europe Ltd respectively. You should consider whether you understand how CFDs work and whether you can afford to take the high risk of losing your money.
Futures and Options: Trading futures and options on margin carries a high degree of risk and may result in losses exceeding your initial investment. These products are not suitable for all investors. Ensure you fully understand the risks and take appropriate care to manage your risk.
Patrick has been involved in the financial markets for well over a decade as a self-educated professional trader and money manager. Flitting between the roles of market commentator, analyst and mentor, Patrick has improved the technical skills and psychological stance of literally hundreds of traders – coaching them to become savvy market operators!